Skip to content
Best Free Graphing Tools
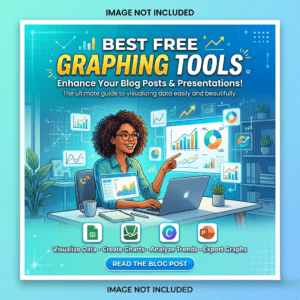
In today’s digital world, data visualization and graph creation have become essential for students, businesses, marketers, and researchers. Whether you need charts for presentations, reports, academic projects, or business analytics, using the best free graphing tools can save time and improve the quality of your work. These tools help users create attractive graphs, charts, and visual data representations without spending money on expensive software.
Many online platforms now offer powerful graphing features completely free. From simple bar charts to advanced mathematical graphs, these tools are designed for beginners and professionals alike. In this article, we will explore the best free graphing tools available today and explain why they are useful for different types of users.
Why Use Free Graphing Tools?
Graphing tools make complex data easier to understand. Visual representation helps people quickly identify trends, patterns, and comparisons. Instead of reading long tables of numbers, users can instantly understand information through charts and graphs.
The best free graphing tools also provide templates, customization options, and collaboration features. Most of them work directly in a web browser, meaning you do not need to install heavy software on your computer.
Here are some major benefits:
- Easy to use for beginners
- Free access to professional features
- Supports multiple graph styles
- Improves presentations and reports
- Saves time and effort
1. Desmos
Desmos is one of the most popular graphing calculators online. It is widely used by students and teachers for mathematics and algebra. The interface is clean, simple, and interactive.
Features of Desmos:
- Interactive graph plotting
- Real-time equation visualization
- Works on mobile and desktop
- Easy sharing options
Desmos is considered one of the best free graphing tools for math learners because it helps users understand equations visually.
2. GeoGebra
GeoGebra combines geometry, algebra, graphing, and calculus into a single platform. It is highly recommended for educational purposes and STEM learning.
Key benefits:
- Advanced mathematical graphing
- Geometry tools included
- Interactive learning resources
- Completely browser-based
Teachers and students around the world use GeoGebra daily because it simplifies complex mathematical concepts.
3. Canva
Canva is famous for graphic design, but it also includes graph and chart creation tools. Users can quickly build pie charts, bar graphs, and infographics using ready-made templates.
Why Canva is useful:
- Drag-and-drop editor
- Professional templates
- Easy customization
- Great for presentations and marketing
If you want visually attractive charts for social media or business reports, Canva is among the best free graphing tools available online.
4. Google Sheets
Google Sheets is a free spreadsheet platform that includes powerful graphing capabilities. It is ideal for businesses, students, and professionals who already work with spreadsheets.
Popular features:
- Automatic chart generation
- Real-time collaboration
- Cloud storage support
- Multiple chart styles
Google Sheets allows teams to work together on data visualization projects from anywhere.
5. Plotly
Plotly is a modern graphing platform designed for advanced data visualization. Developers, analysts, and researchers often use it for interactive charts.
Advantages include:
- Interactive graphs
- Data analytics support
- Scientific chart options
- Web-based dashboard creation
Plotly is one of the best free graphing tools for professionals who need advanced visualization features without expensive software.
6. ChartGo
ChartGo is a lightweight online graph creator that focuses on simplicity. It allows users to create charts quickly without registration.
Features:
- Fast graph creation
- No installation required
- Simple user interface
- Multiple graph types
This tool is perfect for users who need quick and easy charts for reports or assignments.
7. Visme
Visme is another excellent tool for creating graphs, charts, and infographics. It is widely used by marketers and business professionals.
Benefits of Visme:
- Beautiful templates
- Interactive charts
- Presentation-ready designs
- Easy editing tools
For businesses looking to improve visual communication, Visme can be one of the best free graphing tools to try.
Tips for Choosing the Right Graphing Tool
Different users have different needs. Here are a few tips to help you select the best option:
For Students
Choose tools like Desmos or GeoGebra for educational graphing and mathematical calculations.
For Businesses
Use Google Sheets, Canva, or Visme for presentations and professional reports.
For Developers and Analysts
Plotly is ideal for advanced data visualization and interactive analytics.
For Quick Charts
ChartGo works well when you need fast results without creating an account.
Free Image Generation Tools in 2026
Final Thoughts
Using the best free graphing tools can make data easier to understand, improve presentations, and enhance productivity. Whether you are a student solving equations, a teacher explaining concepts, or a business professional presenting analytics, free graphing software offers powerful solutions without any cost.
Today’s online graphing tools are more advanced and user-friendly than ever before. Platforms like Desmos, GeoGebra, Canva, Google Sheets, Plotly, ChartGo, and Visme provide excellent features for different types of users. By choosing the right tool for your needs, you can create professional-quality graphs and charts quickly and efficiently.
If you regularly work with data, visuals, or presentations, trying these best free graphing tools can significantly improve your workflow and communication.